How to Read Candlestick Charts
Candlestick charts are really helpful for people who trade. They make it easy to see how prices are moving and what is happening in the market. When I was new to trading candlestick charts helped me see what was going on and understand what people were buying and selling.
Learning about candlestick charts can really help you get better at understanding what is happening with prices and make decisions when you trade. If you know what the different parts of a candlestick chart mean then it is not so hard to read them. Candlestick charts are a tool, for traders because they give you a clear picture of what is happening in the market.
Understanding the Structure of a Candlestick
Every candlestick is like a picture of how prices moved during a time. This time can be really short like one minute or five minutes. It can also be longer like one hour or one day. You can even pick a time frame if you want.
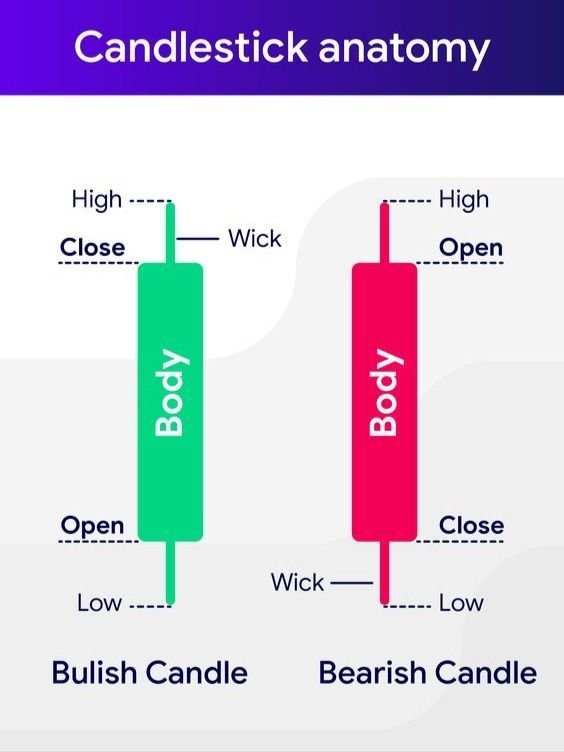
A candlestick has two parts:
* Body
* Wicks. People also call these shadows
The body of the candlestick tells you what the price was when it opened and when it closed. The wicks, on the candlestick show you the price and the lowest price that it got to during that time.
Bullish Candlestick
A bullish candlestick happens when the price of something ends up higher than where it began at the start of a trading day. This means that people who were buying were more active than people who were selling during that time.
When we see a lot of candlesticks one after the other it usually means that buyers are feeling more confident and the market is getting stronger and going up. Bullish candlesticks are a sign for people who like to buy and when we see many bullish candlesticks it is a sign of a strong upward trend in the market, with many bullish candlesticks.
Bearish Candlestick
A bearish candlestick forms when the price closes lower than its opening price for a trading period. This means sellers had control than buyers during that time.
A series of candlesticks can indicate that selling pressure is growing. This might mean the market is going to move. Bearish candlesticks can signal that sellers are, in charge.
Why Candlestick Charts Are Important
Candlestick charts offer a deeper view of price movement by displaying the opening, closing, highest, and lowest prices within a specific period, giving traders more insight than basic line charts.
They allow traders to see market sentiment, price strength, and possible reversals.
By observing candle formations, traders can:
Identify trends
Spot possible reversals
Understand market momentum
Find potential entry and exit points
These insights help traders make better decisions based on actual price behavior
Key Elements to Observe on a Candlestick Chart
When you are going to make a trading decision you should look at the following things carefully. The trading decision is a step so you have to be careful, with the trading decision you are going to make.
Candle Body Size
A big body means people are either buying or selling a lot.
It shows activity.
On the hand a small body means people are not sure what to do.
There is buying and selling happening.
Lower Wick
When you see a lower wick it means that sellers were trying to bring the price down but then buyers came in and started buying so the price went back up. This is what a lower wick tells us about what buyers and sellers are doing with the price. The lower wick is really, about the buyers stepping in and moving the price back up after the sellers pushed it down.
Consecutive Candles
You should not just look at one candle. It is better to see how candles act when they are together. When you look at a lot of candles like a sequence of candles it can give you an idea of what the market is doing. A sequence of candles is really good, at showing you where the market is going.
Common Candlestick Patterns
Some candle patterns show up a lot. They can tell us something about what people think is going to happen in the market. Candle formations, like these can be really useful to look at. The market sentiment is what we are trying to figure out when we look at these candle formations.
Doji
A Doji candlestick shows up when the price at the start of the day is the same as the price at the end of the day. This is a sign that people who want to buy and people who want to sell are evenly matched. The Doji candlestick shows that, during this time neither the buyers nor the sellers were able to take charge of the market. The Doji candlestick is a good sign that the buyers and sellers are balanced.
Hammer
A Hammer has a body and a long lower wick. This Hammer is, like a signal that buyers of the Hammer are starting to get stronger after the price of the Hammer went down. The Hammer is telling us that people who want to buy the Hammer are taking control of the Hammer after the Hammer fell in value.
Shooting Star
A Shooting Star has a body and a long upper wick. This is what it looks like. The Shooting Star can mean that people are selling after the price went up. The Shooting Star is telling us that the selling pressure is getting stronger.
Engulfing Pattern
An Engulfing pattern happens when one candle completely covers the body of the candle. This pattern is something traders often look for because it might mean a trend change is coming.
An Engulfing pattern happens when one candle completely covers the body of the candle. Traders often keep an eye on this pattern because it could signal a trend change.
Tips for Reading Candlestick Charts Effectively
Focus on Price Action
Pay attention to how pricesre moving. Don’t just rely on indicators.
* Candlesticks give you information, about whats happening in the market.
They show you the market activity.
Look at the price movements instead.
Practice on Different Timeframes
To really get what is going on in the market you should look at study charts, for periods of time. This will help you understand market behavior. Looking at study charts for a time and a short time will give you a better idea of what the market is doing. You will see how the market behaves over time by looking at these study charts.
Be Patient
When you are looking at the market do not make a decision based on a candle. It is better to wait for confirmation from candles and the overall market structure. This will give you a picture of what is going on with the market. Always consider candles and the overall market structure to make a good decision, about the market. Wait for candles to confirm what the single candle is showing you about the market.
Frequently Asked Questions
1. What is a candlestick chart?
A candlestick chart is a type of price chart that shows the opening price the closing price, the highest price and the lowest price of something during a time. This time period can be a day or a week or even a month. The candlestick chart is used to look at the prices of things like stocks or currency. It helps people see what the price of a stock or currency was at the start and end of a time period and what the highest and lowest prices were during that time. A candlestick chart is really good, for looking at the price of a stock or currency over time.
2. What does a bullish candlestick indicate?
A bullish candlestick means the closing price is higher than the opening price. This shows that buyers are more active.
When the closing price is higher it indicates buying. The bullish candlestick is a sign of this.
The closing price being higher, than the opening price is what makes a candlestick bullish. It shows buyers are stronger.
Bullish candlesticks help in understanding market trends. They indicate the closing price is higher. This is a sign of buying activity.
3. What does a bearish candlestick indicate?
When we see a candlestick it means the price at the end of the day is lower than the price at the start of the day. This tells us that people are selling more than they are buying. The selling activity is stronger, with a bearish candlestick.
4. Why are candlestick charts popular among traders?
They give you info about how prices move.
The info also includes market feelings and where trends might change.
All of this is presented in a format that’s easy to read and understand.
The details help with price movement, market sentiment and possible changes, in trends.
5. Can beginners learn candlestick charts easily?
Yes. If you understand how candles work and look at charts often you can get good at reading candlestick charts.
It is really helpful for beginners to practice looking at charts every day.
They can learn to see patterns in the candles and make choices.
Candle structure is key to understanding charts.
By practicing beginners can become experts, in reading candlestick charts.
They will be able to make sense of the charts and make decisions.