Trading Chart Patterns: A Beginners Guide to Reading Market Movements
I found that trading chart patterns are really useful for understanding how prices move in the markets. When I first started learning about trading chart patterns helped me see opportunities and understand how the market works more clearly. These patterns are made by the way prices move. Can give us valuable insights into what might happen next.
What Are Trading Chart Patterns?
They are like shapes that we see when we look at the way prices move on a trading chart. Traders study these patterns to try to figure out if a trend will keep going or if it will reverse. Since people in the market often react in ways to changes in price we see certain patterns over and over again.
Chart patterns do not tell us what will happen for sure. They can help us make better decisions when we use them with other tools and manage our risk.
Why Trading Chart Patterns Matter
Understanding trading chart patterns can help traders do a things. For example they can help us:
* Identify trends in the market
* Find good points to get in and out of a trade
* Feel more confident in our trading decisions
* Use analysis to support our decisions
* Better understand how people in the market think and feel
Learning about these patterns can be especially helpful for people who are just starting out and want to develop a way of analyzing charts.
Common Trading Chart Patterns
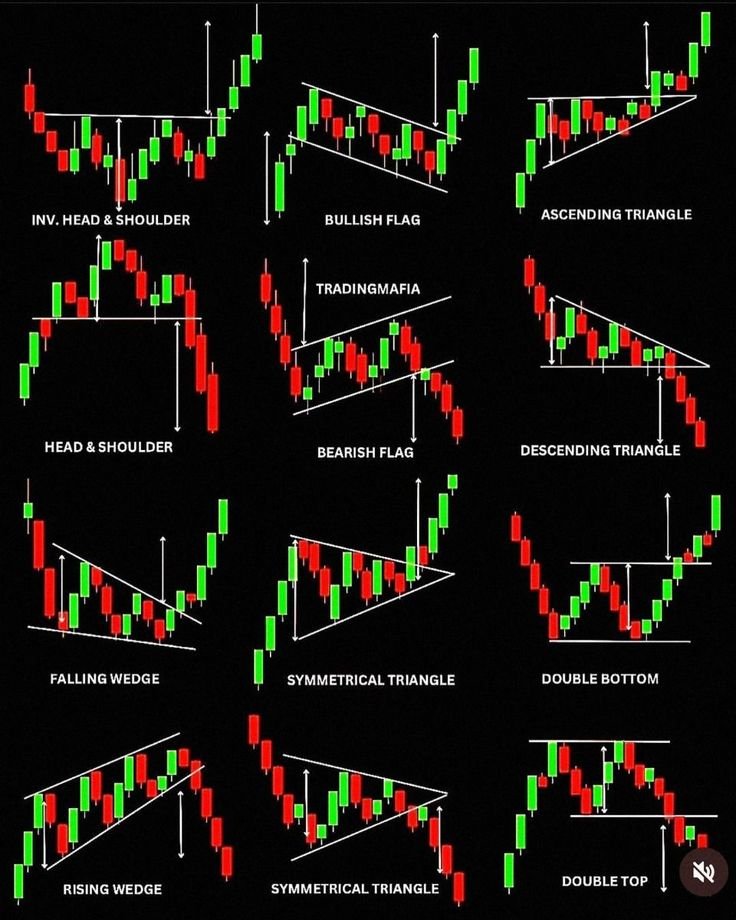
Head and Shoulders Pattern
The Head and Shoulders pattern is an one that can signal a reversal. It has three peaks, with the middle one being the highest. We often see this pattern after the market has been going up. It might mean that the market is getting ready to move down.
Traders pay attention to the neckline because if the price breaks below it it could mean that the trend is about to reverse.
Top and Double Bottom
A Double Top happens when the price reaches a level that it cannot go above twice. This pattern often suggests that the market might be getting ready to move
A Double Bottom is the opposite. It happens when the price tests a level that it cannot go below twice before moving up. This pattern might indicate that the market is getting ready to move up.
Triangle Patterns
Triangle patterns are common when the market is not really moving up or down. There are three types:
* Ascending Triangle
* Descending Triangle
* Symmetrical Triangle
These patterns usually mean that the market is getting ready to make a move.
Continuation Trading Chart Patterns
Flag Pattern
A Flag pattern usually happens after the price has moved a lot. Then the market moves sideways. A little bit against the trend before continuing in the original direction.
Many traders think that this is a sign that the trend will keep going especially if it is supported by the volume of trades and the way the price is moving.
Pennant Pattern
The Pennant pattern is similar to the Flag pattern. It forms a small triangular shape. It often happens after a trend and it might mean that the trend will keep going after the price breaks out.
How to Use Trading Chart Patterns
Confirm the Pattern
We should never just rely on a pattern. We need to wait for the price to move or for technical tools to confirm that the pattern is real.
Manage Risk
Even if we are sure about a pattern it can still fail. We always need to use risk management techniques like stop-loss orders and managing the size of our trades.
Practice Regularly
The best way to learn about trading chart patterns is to look at charts. Reviewing charts can help us recognize patterns more quickly when we are looking at live markets.
Final Thoughts
Trading chart patterns give us a way to visualize how the market is behaving. Whether we are looking at reversal patterns like Head and Shoulders or continuation patterns like Flags and Pennants these formations can help us get better at analyzing the market.
The key is to be patient practice all the time and combine chart patterns with trading habits. Over time recognizing these patterns can become a part of our trading.
Frequently Asked Questions
1. What are trading chart patterns?
Trading chart patterns are like shapes that we see in the way prices move. We use them to try to figure out what the market might do next.
2. Are trading chart patterns right?
Chart patterns can be helpful. They are not always right. We should use them with tools and manage our risk.
3. Which trading chart pattern is best for beginners?
Many beginners start with Top, Double Bottom and Triangle patterns because they are relatively easy to spot.
4. Can we use trading chart patterns in all markets?
Yes we can use trading chart patterns, in stocks, forex, commodities and other financial markets.
5. How can I get better at identifying trading chart patterns?
Looking at charts regularly practicing and reviewing market data can help us get better at recognizing patterns over time.